Reference classes
We use three levels of evidence, from general to specific, combined with
partial pooling to estimate a time-varying monthly hazard rate.
Level 1: General territorial dispute base rate
Among all major-power territorial disputes post-1945, roughly 1-2% per year
escalate to significant military action. This comes from the Correlates of War
MID dataset (~2,400 militarized interstate disputes 1816-2014, 85% of fatal
conflicts involving territorial issues). This is the weakest prior — just
a sanity floor.
Level 2: Major powers with active military buildup for a specific territorial goal
This is the core reference class. We identified 13 historical
cases — 8 that resulted in military action, 5 where no action
has been taken despite decades of tension.
Cases that resulted in military action:
| Case | Buildup start | Action year | Time to action |
|---|
| China → Tibet | 1949 | 1950 | 1 years |
| Indonesia → East Timor | 1974 | 1975 | 1 years |
| Iraq → Kuwait | 1988 | 1990 | 2 years |
| Argentina → Falklands | 1976 | 1982 | 6 years |
| Russia → Crimea | 2008 | 2014 | 6 years |
| Turkey → Cyprus | 1964 | 1974 | 10 years |
| India → Goa | 1947 | 1961 | 14 years |
| Russia → Ukraine (full) | 2014 | 2022 | 8 years |
Cases where no military action has been taken:
| Case | Buildup start | Duration so far |
|---|
| China → Taiwan | 1949 | 77+ years (ongoing) |
| India → Pak Kashmir | 1947 | 79+ years (ongoing) |
| Greece → Turkey Aegean | 1974 | 52+ years (ongoing) |
| N. Korea → S. Korea | 1953 | 73+ years (ongoing) |
| Venezuela → Essequibo | 1966 | 60+ years (ongoing) |
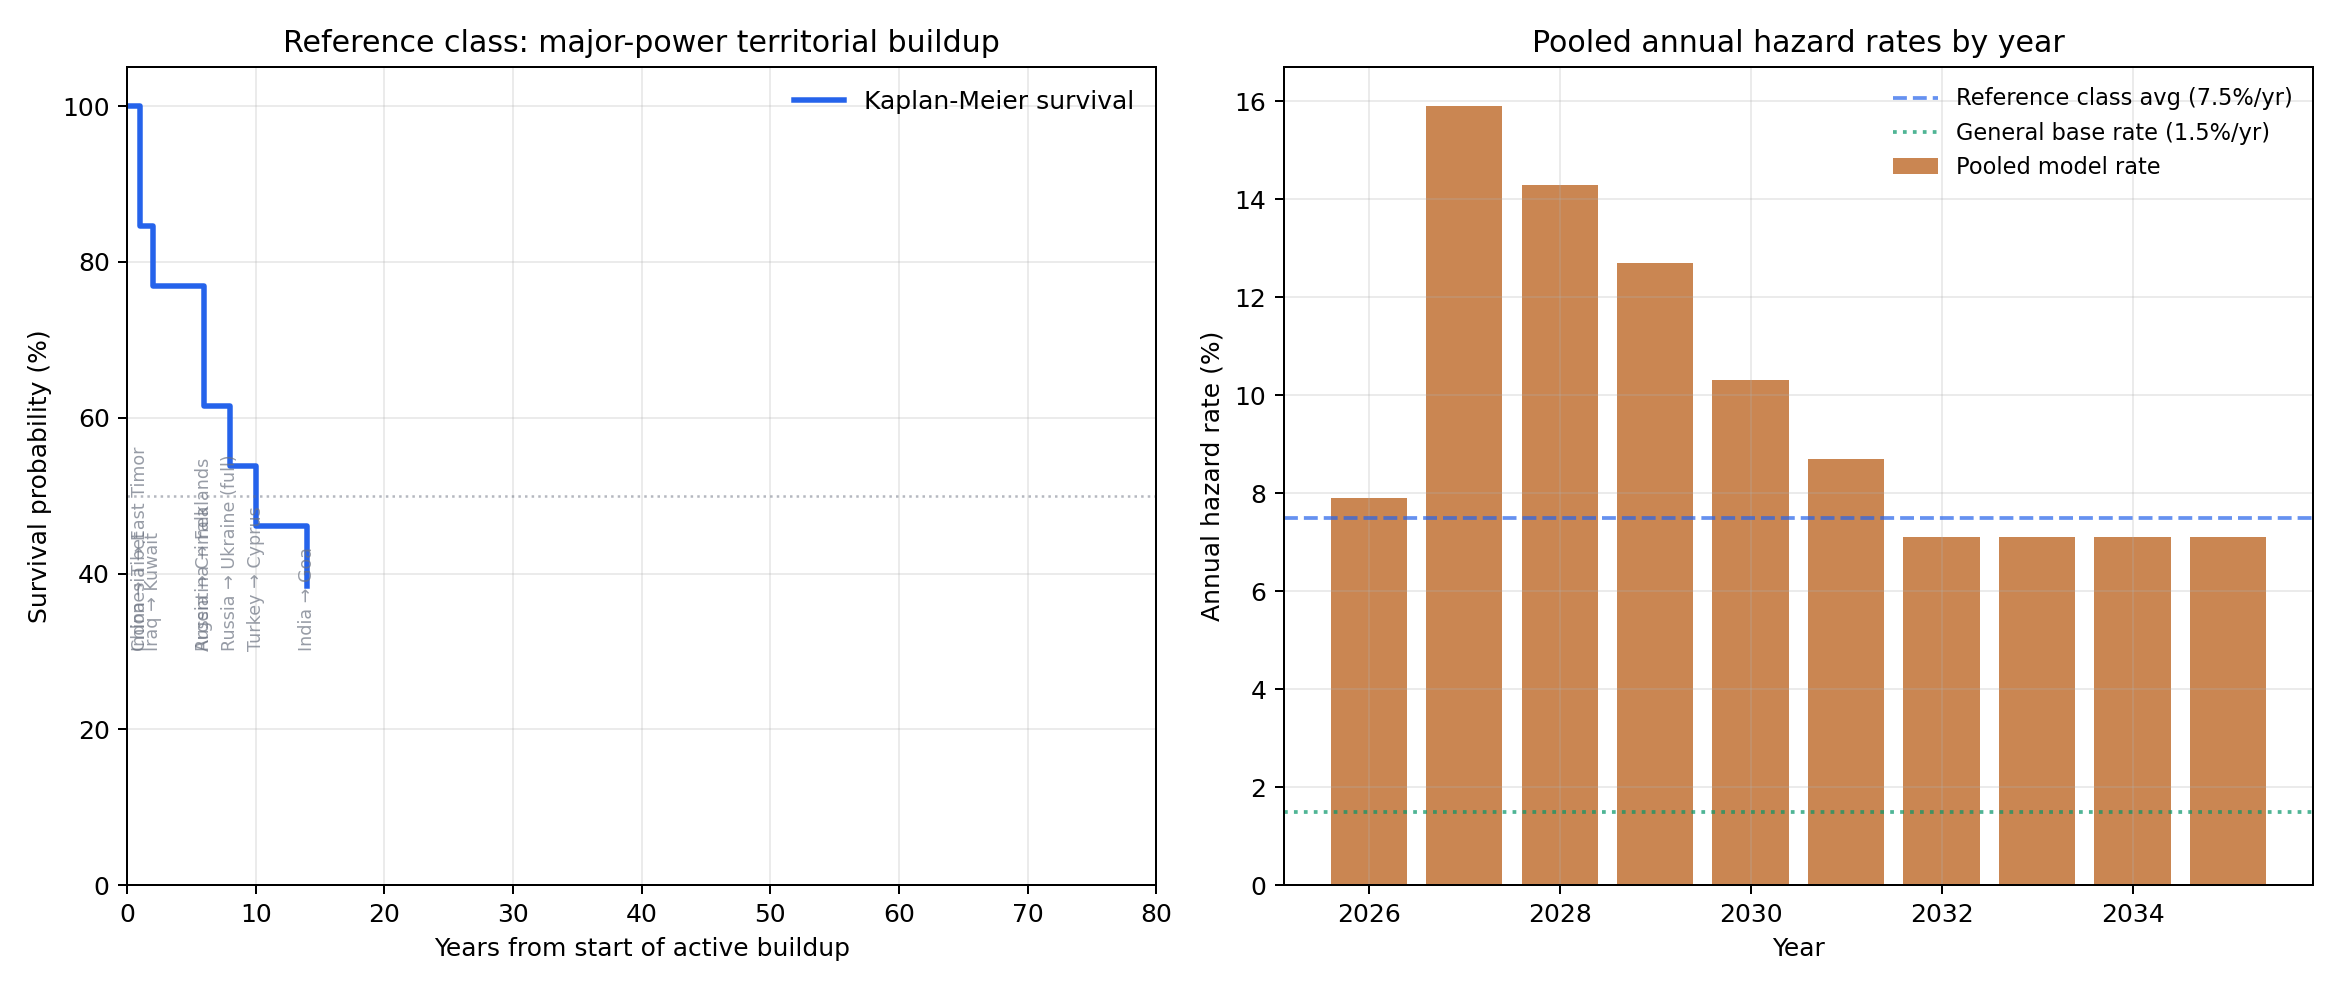
Kaplan-Meier survival analysis of these 13 cases gives roughly
54% probability of action within 10 years of active buildup
starting, implying an average annual hazard of ~7.5%/year during the buildup
phase. The median time to action among those that acted was ~6 years.
The cases where no action was taken are critical — they show that roughly
40% of these disputes simply never result in full military action, even over
many decades. China-Taiwan itself is the longest-running such case at 77 years.
Level 3: China-Taiwan specific expert data
Current prediction markets and expert surveys (as of March 2026) provide the
most directly relevant evidence:
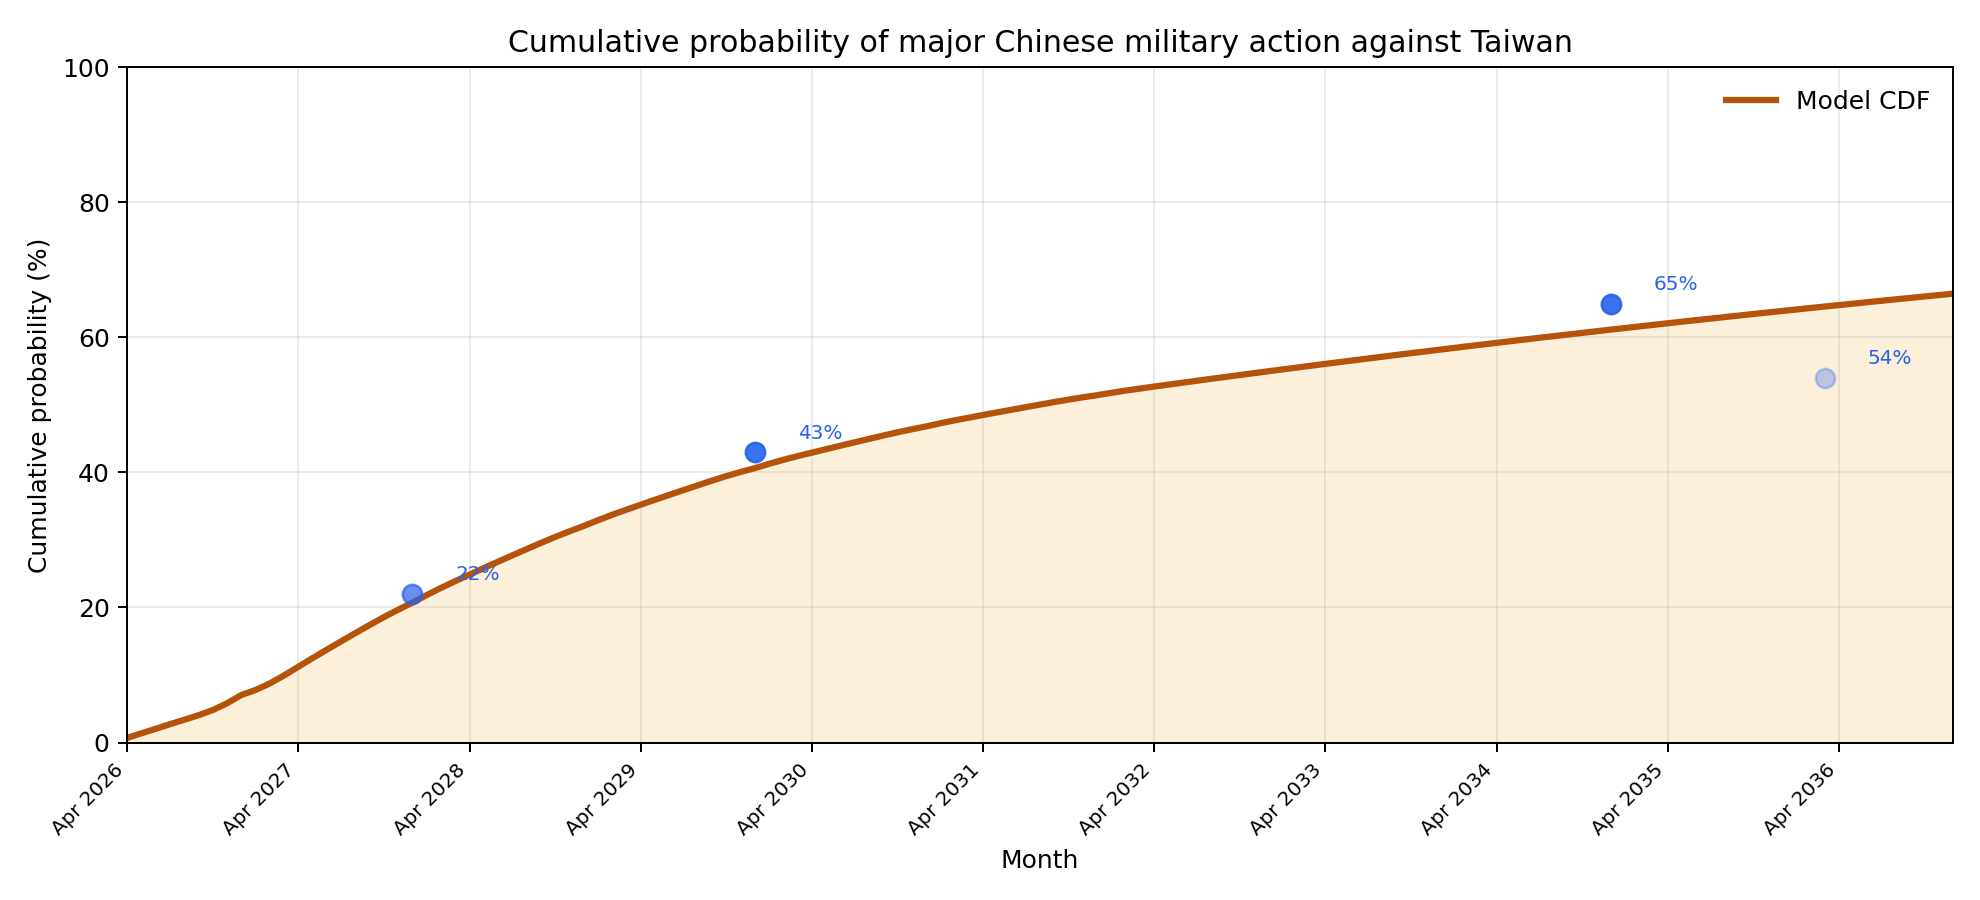
- Metaculus: full-scale blockade by 2030 at 40%, by 2035 at 60%;
full-scale invasion by 2028 at 10%, by 2030 at ~20%, by 2035 at ~33%
- CSIS 2024 survey: 52% of 64 China experts think force short of
invasion “likely” within 10 years; only 27% of US experts and 17% of
Taiwan experts believe China can currently execute an amphibious invasion
- Swift Centre: 9% blockade probability by mid-2027
- Pentagon 2025 report: PLA targeting capability to fight and
win a Taiwan war by end of 2027; new bridge landing vessels and expanded
amphibious training observed
These imply annualised hazard rates of ~12-16%/year near-term (peaking
2027-2028 around the PLA modernisation milestone), declining to ~7%/year
long-term.
Multilevel model
The posterior annual hazard rate for each year is a weighted
average of Level 2 and Level 3:
λ_pooled(year) = 0.80 × λ_specific(year) + 0.20 × λ_group
- 80% weight on Level 3 (specific): prediction markets
aggregate hundreds of forecasters with diverse information —
substantially more informative than the small historical sample.
- 20% weight on Level 2 (group): the reference class pull
prevents overconfidence and anchors the long-run tail to historical base
rates.
Level 1 is absorbed into Level 2 (the Kaplan-Meier already incorporates the
non-action cases).
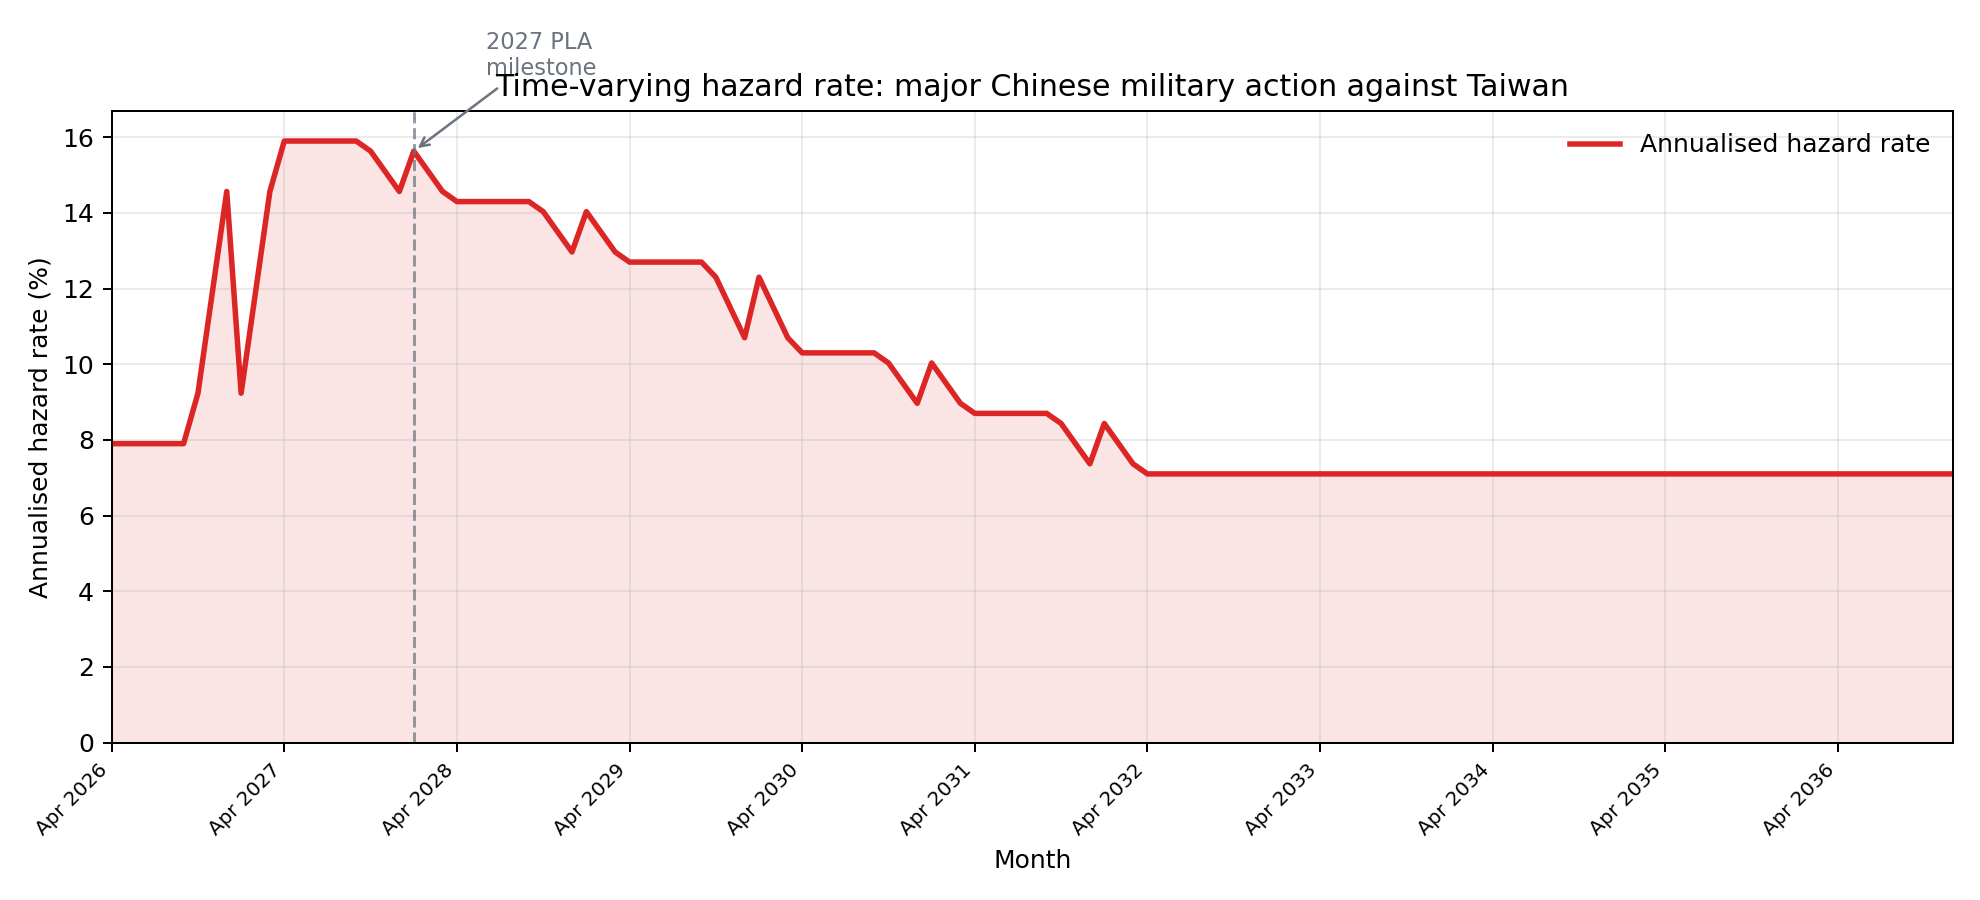
Time variation
The hazard rate is time-varying: it peaks in 2027 (the PLA's
stated modernisation deadline, the consensus “window of maximum
danger” identified by military analysts) then gradually declines as the
specific risk window passes. It remains well above the general base rate
throughout the forecast horizon due to the structural nature of the
cross-strait dispute. Monthly values are smoothed via linear blending at year
boundaries, then converted to a cumulative CDF via the survival function.
Hazard rates and cumulative probabilities by year
| Year | Annual hazard (pooled) | Cumulative P(action by year-end) |
|---|
| 2026 | 7.9% | 7.0% |
| 2027 | 15.9% | 20.7% |
| 2028 | 14.3% | 32.1% |
| 2029 | 12.7% | 40.6% |
| 2030 | 10.3% | 46.8% |
| 2031 | 8.7% | 51.4% |
| 2032 | 7.1% | 55.0% |
| 2033 | 7.1% | 58.2% |
| 2034 | 7.1% | 61.1% |
| 2035 | 7.1% | 63.9% |
Resolution criteria
This market resolves to the earliest date at which any of the following conditions is reported by at least two of AP, Reuters, and AFP: (a) at least 1,000 People's Liberation Army military personnel have been deployed to the main island of Taiwan for the purpose of establishing PRC sovereignty; (b) the People's Republic of China has imposed a blockade that closes all major Taiwanese ports (Kaohsiung, Keelung, Taichung, and Taipei) for at least 10 consecutive days; or (c) the People's Republic of China has launched kinetic strikes (missiles, airstrikes, or naval bombardment) against military or civilian infrastructure on the main island of Taiwan. Exclusions: military exercises that do not actively intercept traffic or strike targets; cyber-only operations; actions limited to outlying islands (Kinmen, Matsu, Penghu) without action against the main island; economic sanctions or trade restrictions without physical military action.
Sources
Download the Python script used for this analysis
Very unlikely in the next couple of years given the extensive purges in the PLA.
Also very unlikely to happen outside of March–May and September–October.
Worth watching this video of their amphibious vehicle to realise how bad rough seas will be.