Nebius annual revenue
Each yearly projection group resolves to Nebius Group's consolidated annual revenue for that fiscal year (FY2026 through FY2035), on a non-cumulative basis, in USD millions (displayed as USD billions in chart labels), from the company's audited annual report, Form 20-F, or official full-year financial results release. If Nebius materially changes reporting structure, use the most directly comparable consolidated revenue-from-continuing-operations figure explicitly disclosed for that fiscal year.
v1 (2026-04-27)
current
Calculation of starting probabilities
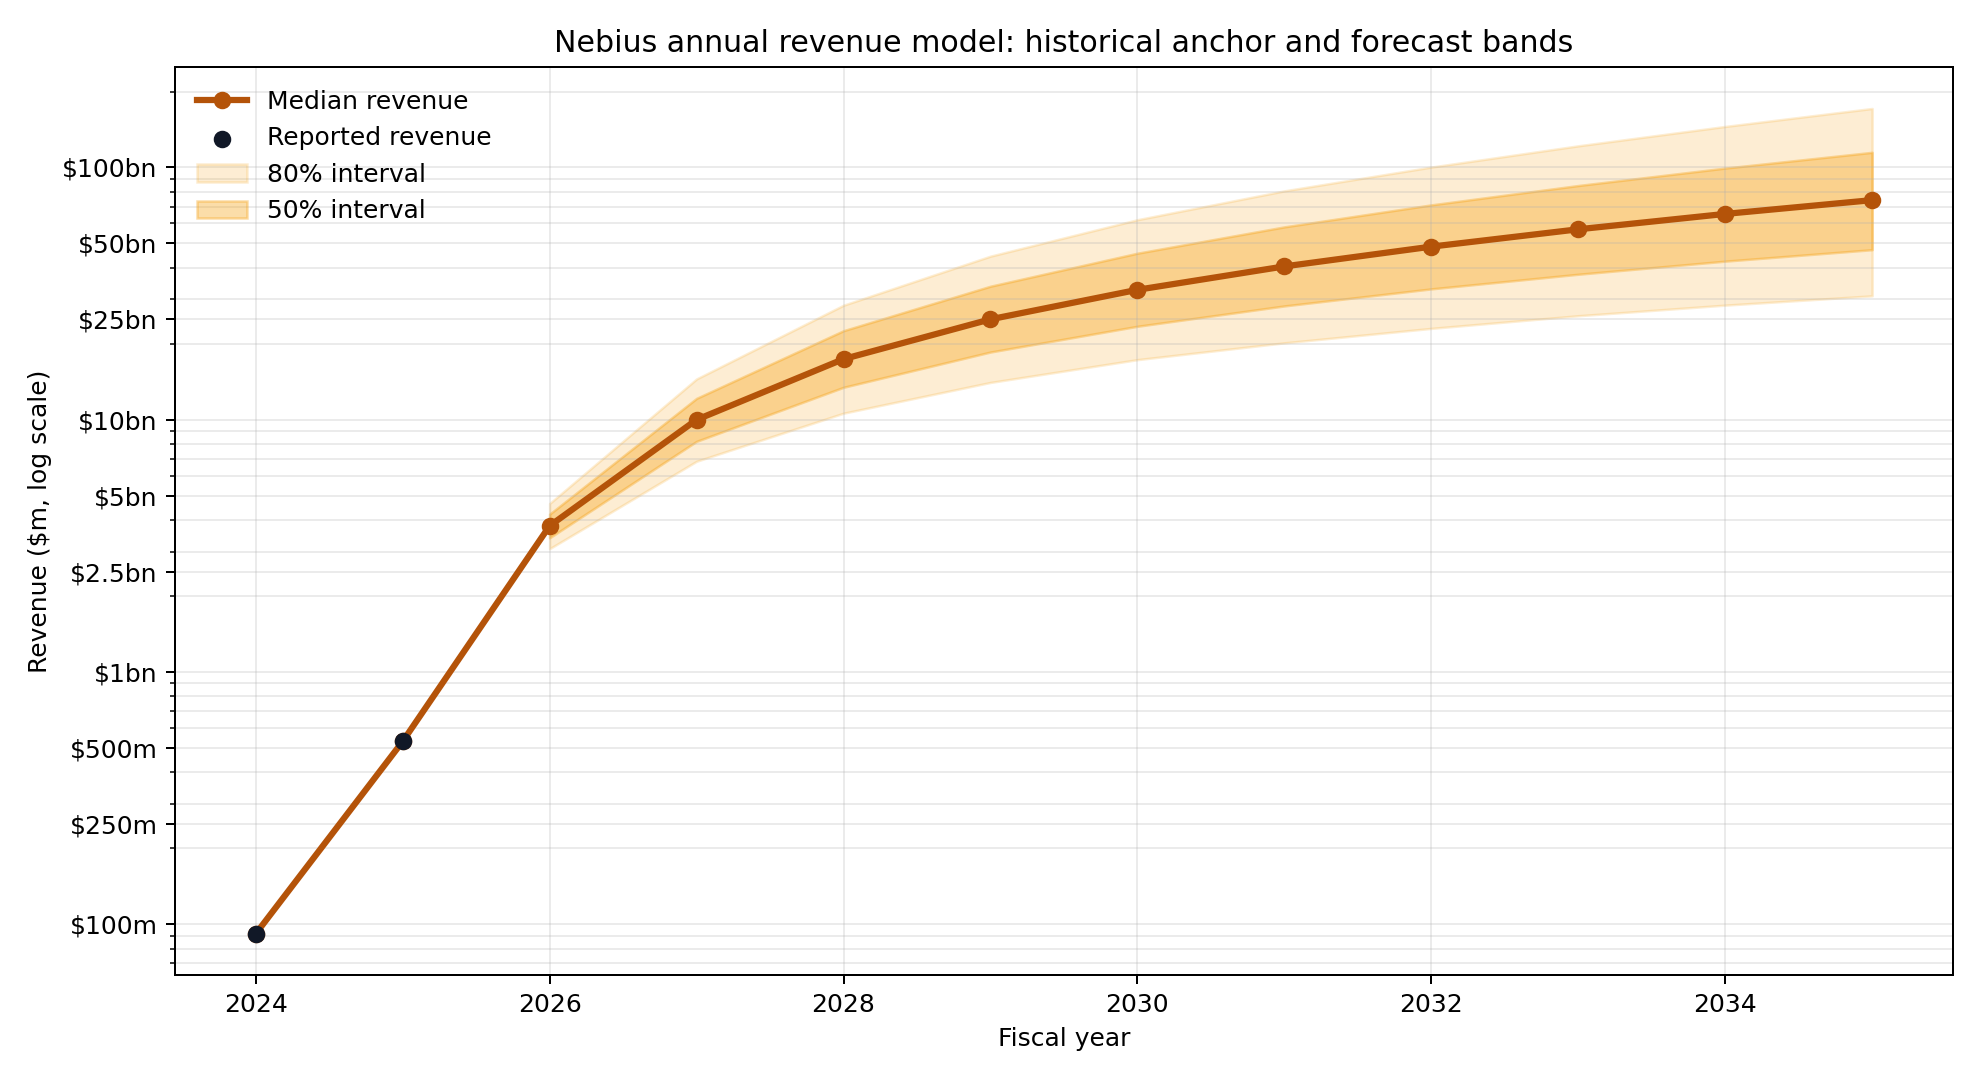
This market uses a three-level revenue model for Nebius's non-cumulative annual revenue over FY2026-FY2035. The model combines: (1) Nebius-specific execution signals, (2) a comparable cloud-platform reference class, and (3) a general firm-growth base rate from the academic literature so the forecast does not naively extrapolate one explosive year forever.
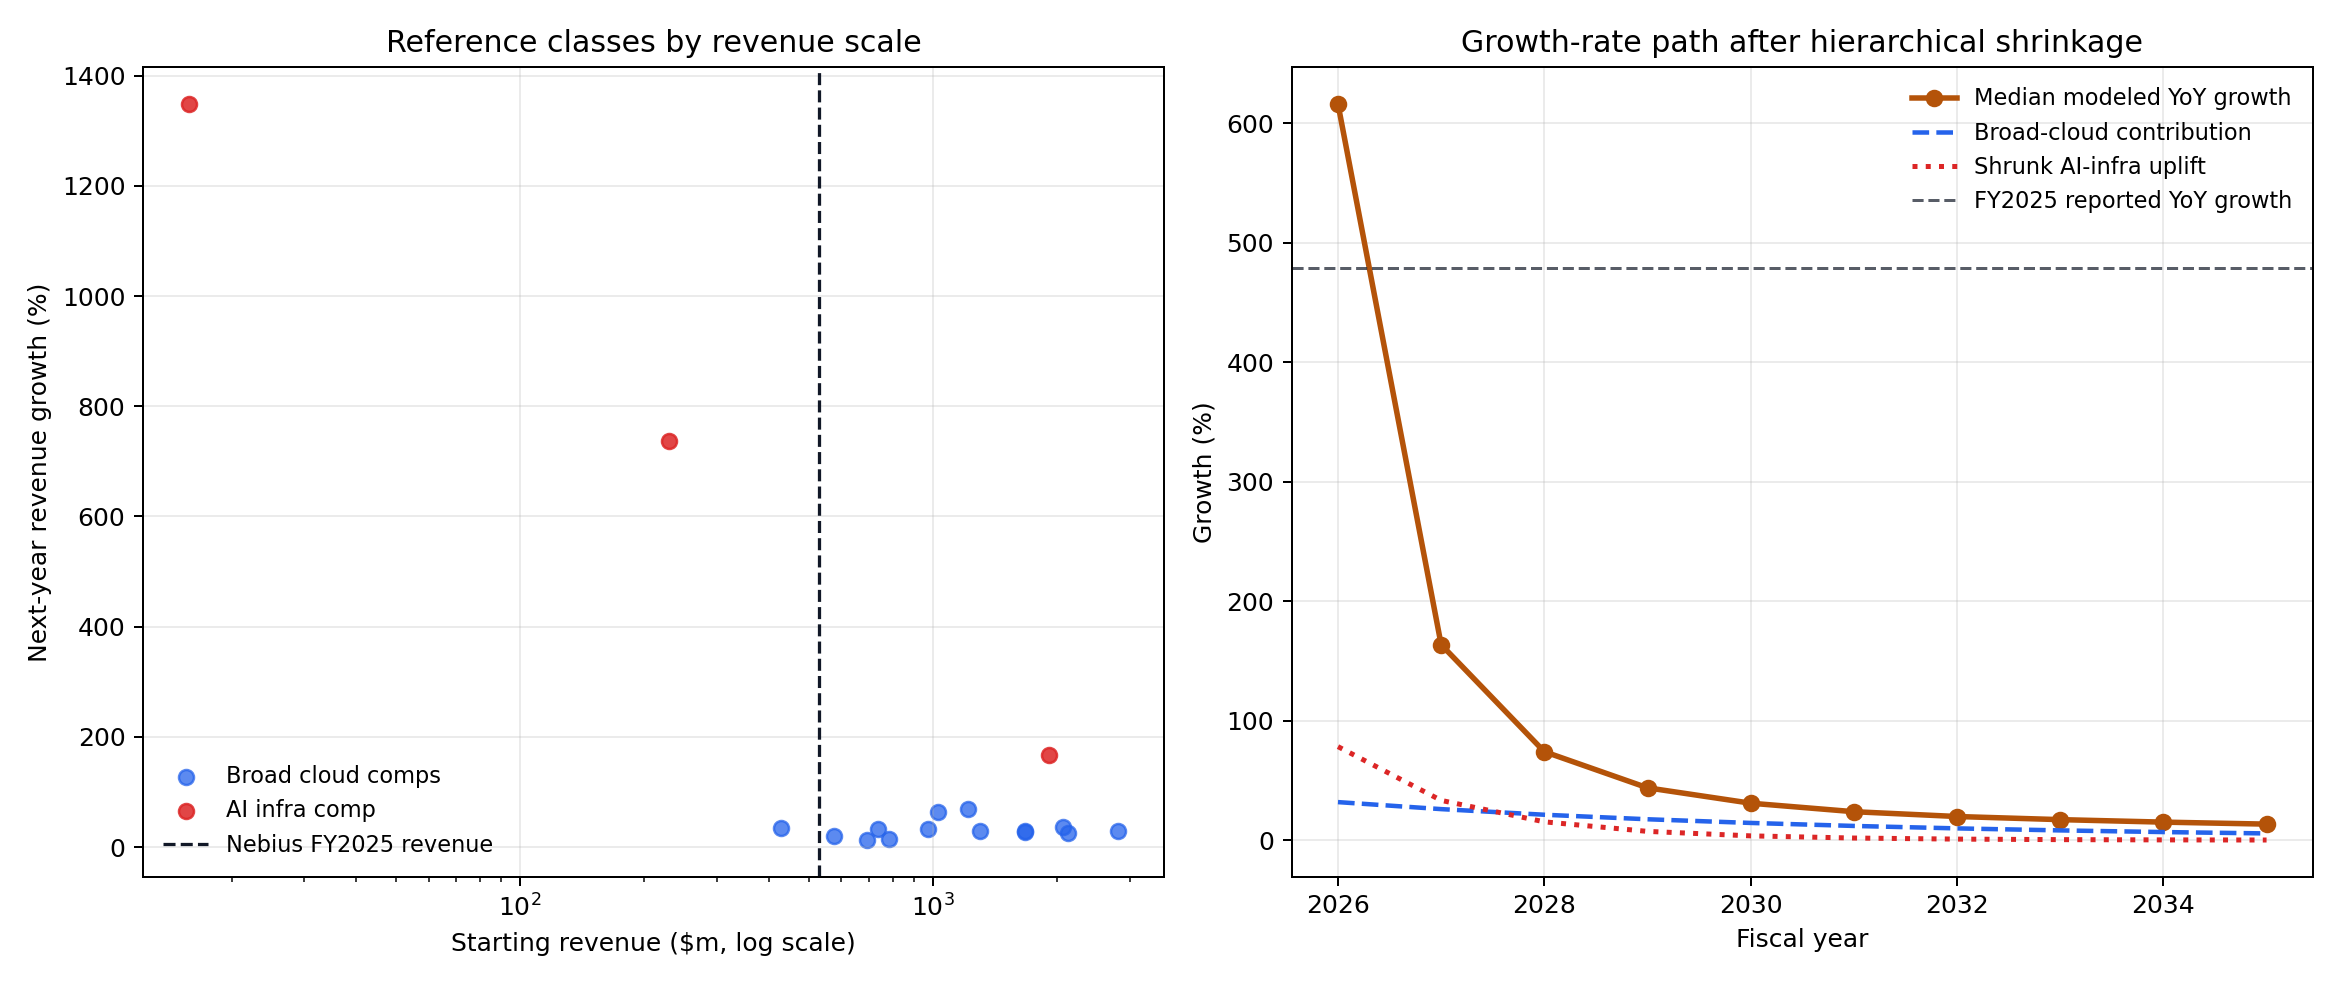
Resolved anchor from the last completed financial year: Nebius reported $529.8m of FY2025 revenue versus a recast FY2024 continuing-operations revenue of $91.5m, which is +479% year over year. That value is included here as a calibration aid; the market itself stays in revenue units only.
Key charts
Why these reference classes
- Nebius-specific: FY2025 revenue, year-end ARR of about $1.25bn, FY2026 end-year ARR guidance of $7bn-$9bn, the Microsoft agreement announced in December 2025, and disclosed power-capacity targets (800MW-1GW active in 2026; more than 3GW contracted).
- Broad cloud/platform cohort: Cloudflare, DigitalOcean, Datadog, and Snowflake. Their observed mean annual log-growth in the sample used here is about 32%, which prevents the model from treating Nebius as a generic mature company too early.
- AI-infrastructure uplift: CoreWeave is used as the direct AI-cloud analogue, but only after strong shrinkage. Its raw growth history is much hotter (mean about 587%), so the model only takes a partial, decaying uplift from that reference class to reduce single-comparable bias.
- Guidance-error outside view: the FY2026 anchor is built from management's end-2026 ARR guidance converted to a FY2026 revenue center (about $4,441m before pooling). The model then gives this guidance layer about 87% average weight in FY2026 because near-term guidance has higher predictive power than unconstrained long-horizon structural simulation.
- Companies in general: the academic literature says firm growth shocks are heavy-tailed, high growth is rarely persistent forever, and volatility falls with size. That is why the simulation uses fat-tailed shocks and size-scaled volatility instead of a smooth deterministic curve.
Model structure
- Global layer: long-run revenue growth mean-reverts toward a modest positive floor, with shock volatility shrinking roughly with firm size.
- Sector layer: Nebius inherits a broad-cloud growth premium estimated from comparable public firms, plus a shrunk AI-infrastructure uplift that decays as the market matures.
- Company and guidance layer: FY2026 first forms a structural path from the global+sector model, then precision-pools it with a guidance-derived revenue center using inverse-variance weights. That keeps the outside view, but prevents excessive mass far below near-term guidance.
- Simulation: 80,000 Monte Carlo paths produce yearly revenue samples, and each year's market ladder is the survival curve
P(revenue >= threshold)at 50 friendly-rounded thresholds.
Forecast summary
| Fiscal year | Median | P10 | P90 |
|---|---|---|---|
| FY2026 | $3.8bn | $3.1bn | $4.7bn |
| FY2027 | $10.0bn | $6.8bn | $14.5bn |
| FY2028 | $17.4bn | $10.6bn | $28.4bn |
| FY2029 | $25.0bn | $14.1bn | $44.5bn |
| FY2030 | $32.7bn | $17.3bn | $62.1bn |
| FY2031 | $40.5bn | $20.2bn | $80.8bn |
| FY2032 | $48.5bn | $23.0bn | $100.4bn |
| FY2033 | $56.9bn | $25.8bn | $121.9bn |
| FY2034 | $65.5bn | $28.5bn | $145.5bn |
| FY2035 | $74.2bn | $31.0bn | $171.4bn |
Source notes
- Nebius FY2025 results: FY2025 revenue of $529.8m and recast FY2024 revenue of $91.5m.
- Nebius Q3 2025 shareholder letter: year-end ARR of about $1.25bn, FY2026 end-year ARR guidance of $7bn-$9bn, and power-capacity targets.
- Nebius-Microsoft agreement: direct evidence that the company has unusually strong near-term demand support.
- Stanley et al. (1996) and Bottazzi & Secchi (2006): motivation for fat-tailed growth shocks and size-sensitive volatility.
- World Bank high-growth firms review: motivation for mean reversion and caution about assuming repeated hypergrowth episodes.
Data and reproducibility assets
Liquidity over time
i Shows the market’s available liquidity over time. Liquidity can decay continuously and may change discretely if liquidity adjustments are applied.Loading…
0 comments
Log in to comment.