No probability history is available for this market yet.
Strait of Hormuz weekly transit calls
This market resolves using the n_total variable (daily transit calls) for portid='chokepoint6' (Strait of Hormuz) from the PortWatch 'Daily Chokepoint Transit Calls and Trade Volume Estimates' API.
Each row corresponds to one ISO week in UTC, ending on Sunday (projection_group = YYYY-Www). The resolved value for each weekly group is the sum of n_total across all UTC days from Monday through Sunday of that ISO week. Each threshold row resolves YES if the weekly total is greater than or equal to threshold_decimal, otherwise NO.
Reference page: IMF PortWatch chokepoint page (Strait of Hormuz).
The linked PortWatch chart includes tanker traffic, but its hover readout does not show numeric values for every vessel category at once. This market resolves on overall n_total transit calls, not any single category-specific hover value.
If historical values are revised, resolution values will be updated accordingly.
v1.1 (2026-03-26)
current
How Starting Probabilities Were Calculated
The starting probabilities of this market were calculated by combining the recent Strait of Hormuz traffic data with historical chokepoint disruption episodes from PortWatch. The model uses reference classes and partial pooling to keep the estimate data-driven while avoiding overfitting to any single bottleneck.
For this weekly market, the model forecasts daily n_total first and then sums those daily calls across each ISO week (Monday-Sunday UTC) to produce the traded weekly totals.
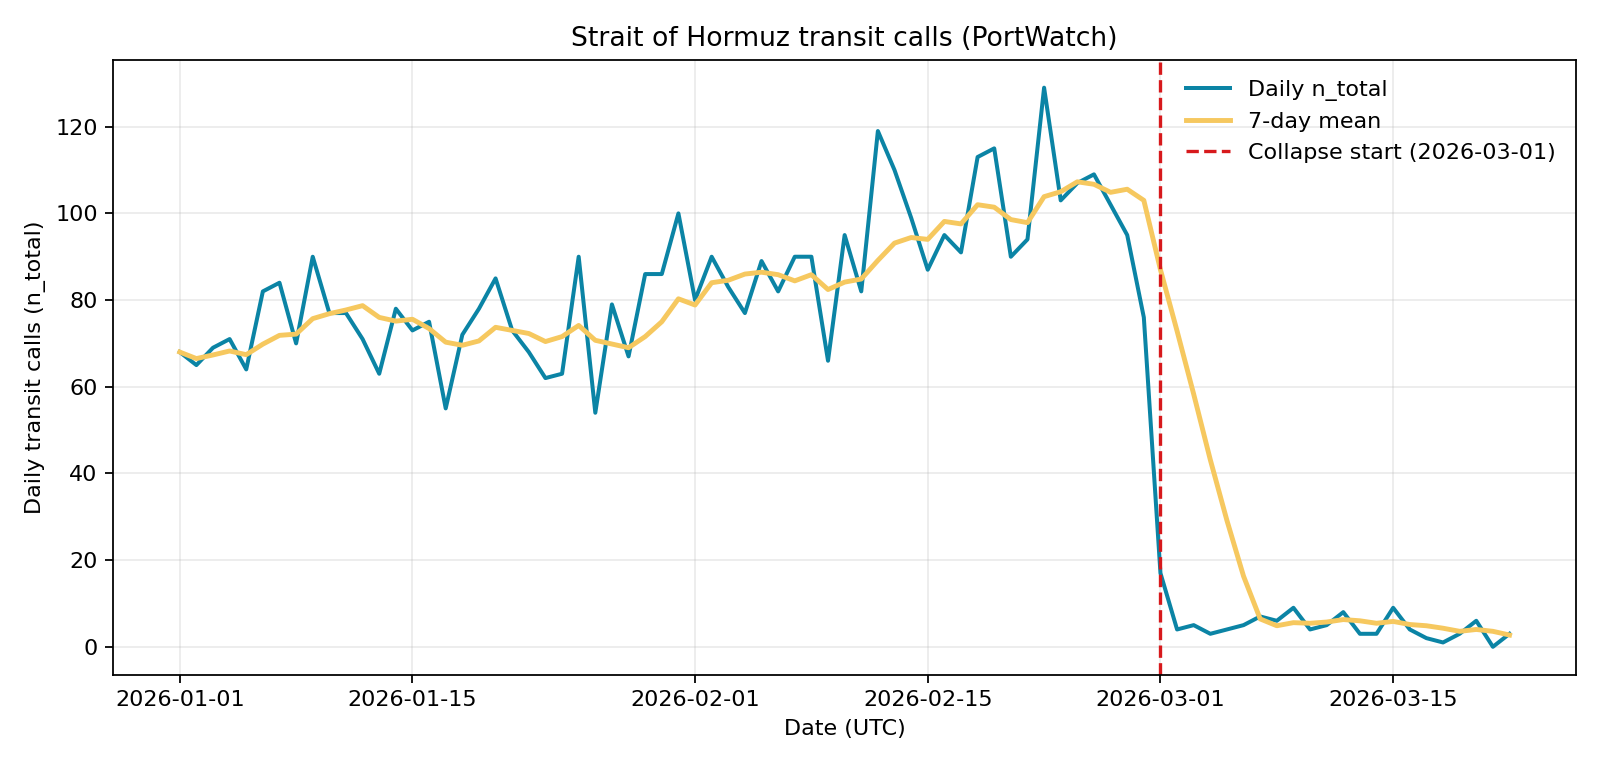
Recent traffic collapse in Hormuz
PortWatch shows a sharp break in traffic: 76 calls on 2026-02-28, then 17 calls on 2026-03-01. The average from 2026-03-02 to 2026-03-22 was 4.5 calls/day.
The linked IMF PortWatch page is useful context, and it does include tanker traffic, but the hover UI does not
show numeric values for every vessel category at once. This market uses the full n_total series
for Strait of Hormuz transit calls, so it is not resolving on a tanker-only subset or a category-specific
hover figure.
Reference classes used
- Conflict-affected disruptions used for fitting: 29 episodes.
- Conflict-affected chokepoints: 29 episodes in Suez, Bosporus, Bab el-Mandeb, and Kerch where traffic fell to 35% or less of baseline.
- Current Hormuz event: treated as ongoing evidence, with duration at least 22 days as of 2026-03-22.
- Conflict reference-class duration summary: median 28.0 days, 90th percentile 151.0 days.
- External-duration prior (non-PortWatch analogues): 4 analogues with representative durations, added with low weight.
- Model-fit exclusions: 10 episodes from diversion-heavy routes (currently Cape of Good Hope) were excluded from fitted classes to avoid treating rerouting volatility as shutdown risk.
This run intentionally uses a conflict-only reference class for disruption duration and post-recovery behavior. That keeps starting probabilities anchored to geopolitically similar episodes, rather than blending with broader non-conflict disruptions.
Most high-weight examples in this run are conflict-linked disruptions in Suez, Bab el-Mandeb, Bosporus, and Kerch, plus longer conflict analogues such as the Tanker War and the post-2023 Red Sea attacks.
To avoid overconfidence from repeated episodes at the same chokepoint, we use an effective-sample-size adjustment: additional episodes from the same chokepoint count as 35% of a fully independent observation. Effective sample size in the conflict class was 12.8. External conflict analogues use overlap discounting: if partly represented in PortWatch, their weight is reduced to 35%.
Post-recovery attenuation (below 100% after reopening)
Historical episodes often reopen before traffic is fully back to the pre-shock baseline. We therefore include a post-recovery attenuation factor, so "recovered" traffic can stay somewhat below 100% for a while instead of jumping immediately to full baseline levels.
From the conflict-affected reference class, the average post-recovery ratio (n_total / pre-shock baseline) had medians of 96.3% at 30 days, 97.6% at 60 days, and 99.1% at 90 days.
Because this run is conflict-only, the attenuation fit uses conflict episode ratios directly (with shrinkage toward their pooled conflict mean). The Hormuz attenuation factor used by the model is 96.0% around 30 days after recovery, then gradually decays back toward 100% with an estimated half-life of 90.6 days.
Final blend weights in the model: 45.0% current-Hormuz stress assumption, 25.0% conflict-affected history, 30.0% external-duration prior.
Key conflict-affected examples (longest disruptions)
| Bottleneck | Start | End | Duration (days) | Lowest traffic vs pre-shock baseline | Possible context (news/reports) |
|---|---|---|---|---|---|
| Kerch Strait | 2022-06-15 | 2022-12-26 | 195 | 7.7% | AP: Ukraine war-related attacks on Crimea bridge |
| Kerch Strait | 2019-11-04 | 2020-04-30 | 179 | 1.7% | N/A |
| Kerch Strait | 2025-09-09 | 2026-03-02 | 175 | 7.7% | AP: Ukraine war-related attacks on Crimea bridge |
| Kerch Strait | 2020-11-01 | 2021-03-25 | 145 | 0.0% | N/A |
| Bosporus Strait | 2025-12-28 | 2026-03-08 | 71 | 5.7% | N/A |
| Kerch Strait | 2019-08-04 | 2019-10-09 | 67 | 9.7% | N/A |
| Bosporus Strait | 2025-02-20 | 2025-04-16 | 56 | 25.0% | N/A |
| Kerch Strait | 2019-02-05 | 2019-03-23 | 47 | 16.3% | N/A |
Key Red Sea route disruption examples (Suez and Bab el-Mandeb)
| Bottleneck | Start | End | Duration (days) | Lowest traffic vs pre-shock baseline | Possible context (news/reports) |
|---|---|---|---|---|---|
| Bab el-Mandeb Strait | 2025-12-09 | 2026-01-05 | 28 | 31.6% | AP: Red Sea attacks forced rerouting around Africa AP: UN says Red Sea attacks reshaped global trade routes |
| Suez Canal | 2025-04-30 | 2025-05-26 | 27 | 45.3% | N/A |
| Suez Canal | 2024-09-03 | 2024-09-25 | 23 | 45.0% | N/A |
| Suez Canal | 2024-12-12 | 2024-12-26 | 15 | 29.4% | N/A |
Additional conflict analogues considered
| Analogue | Representative duration (days) | Included in model? | How included | Source |
|---|---|---|---|---|
| Tanker War (1984-1988) | 1561 | Yes | external_duration_prior | Wikipedia: Tanker War |
| Red Sea / Bab el-Mandeb after Houthi attacks | 774 | Yes | portwatch_plus_external_prior | AP: Red Sea attacks forced rerouting around Africa |
| Black Sea after 2022 invasion | 533 | Yes | portwatch_plus_external_prior | AP: temporary Black Sea corridor after grain-deal exit |
| 2019 Gulf tanker crisis | 237 | Yes | external_duration_prior | AP: reference to 2019 limpet-mine tanker attacks |
How daily call counts were modeled
- Low-traffic phase (from recent Hormuz collapse): mean 4.48, variance 5.76.
- Recovered phase (from pre-collapse Hormuz period): base mean 87.20, variance 284.62.
- Post-recovery attenuation: recovered mean is multiplied by a factor that starts below 1 and relaxes back toward 1 over time.
For each future day, the model combines those two distributions using the estimated probability that traffic has recovered by that day, plus the attenuation factor to reflect slower normalization after reopening.
Fitting charts
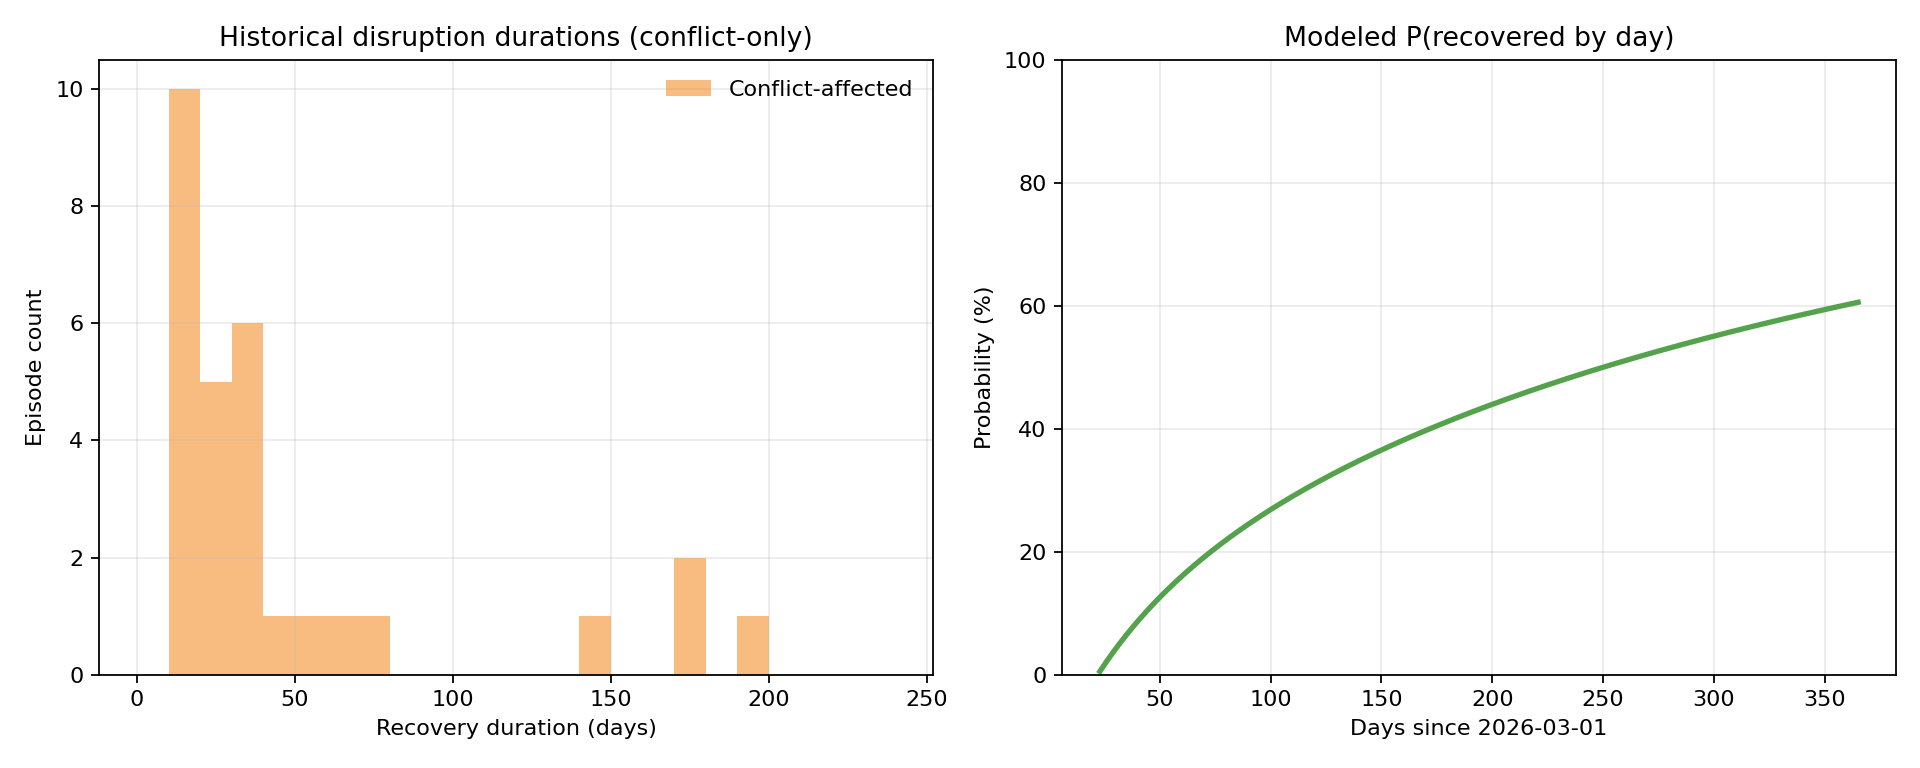
Estimated chance that traffic has recovered by day N
| Days since 2026-03-01 | P(recovered by day) |
|---|---|
| 30 | 4.2% |
| 60 | 16.0% |
| 90 | 24.5% |
| 120 | 31.1% |
| 180 | 41.2% |
Estimated recovered-state traffic level by day N
| Days since 2026-03-01 | Recovered-state multiplier |
|---|---|
| 30 | 96.0% |
| 60 | 96.0% |
| 90 | 96.4% |
| 120 | 96.8% |
| 180 | 97.5% |
Data sources
- IMF PortWatch chokepoint page (Strait of Hormuz)
- PortWatch dataset metadata
- PortWatch API query endpoint for Hormuz n_total
Methodology files
Download the Python methodology script
Download the model summary JSON
Data snapshot used: 2026-03-22 (UTC).
Liquidity over time
i Shows the market’s available liquidity over time. Liquidity can decay continuously and may change discretely if liquidity adjustments are applied.Open this panel to load liquidity history.
0 comments
filter:
sort: